
The Heresy
Every software engineer has been taught the same gospel: technical debt is bad. Pay it down. Refactor early. Don’t cut corners. The orthodoxy says shortcuts today become shackles tomorrow.
I believed this too. Then I spent a year measuring it.
I analyzed the actual codebases of 70 venture-backed startups — companies like GitLab, Sentry, Supabase, PostHog, dbt Labs, Grafana Labs, Elasticsearch, CockroachDB, n8n, Metabase, Temporal, and Strapi — across 146 funding periods. I measured their technical debt. I measured how fast they shipped. I checked whether they raised their next round.
The result that kept staring back at me: the startups with the most technical debt and the highest development velocity had the best funding outcomes. Period. A 60.6% success rate — higher than the “sustainable growth” companies doing everything by the book (57.5%). And the companies with the cleanest code? They had the lowest funding success rate in the entire dataset at 44.4%.
Software engineering’s most sacred cow might be wrong — or at least, not universally right.
What I Actually Measured
Before the pitchforks come out, let me explain the methodology. I didn’t just eyeball repos and make vibes-based claims.
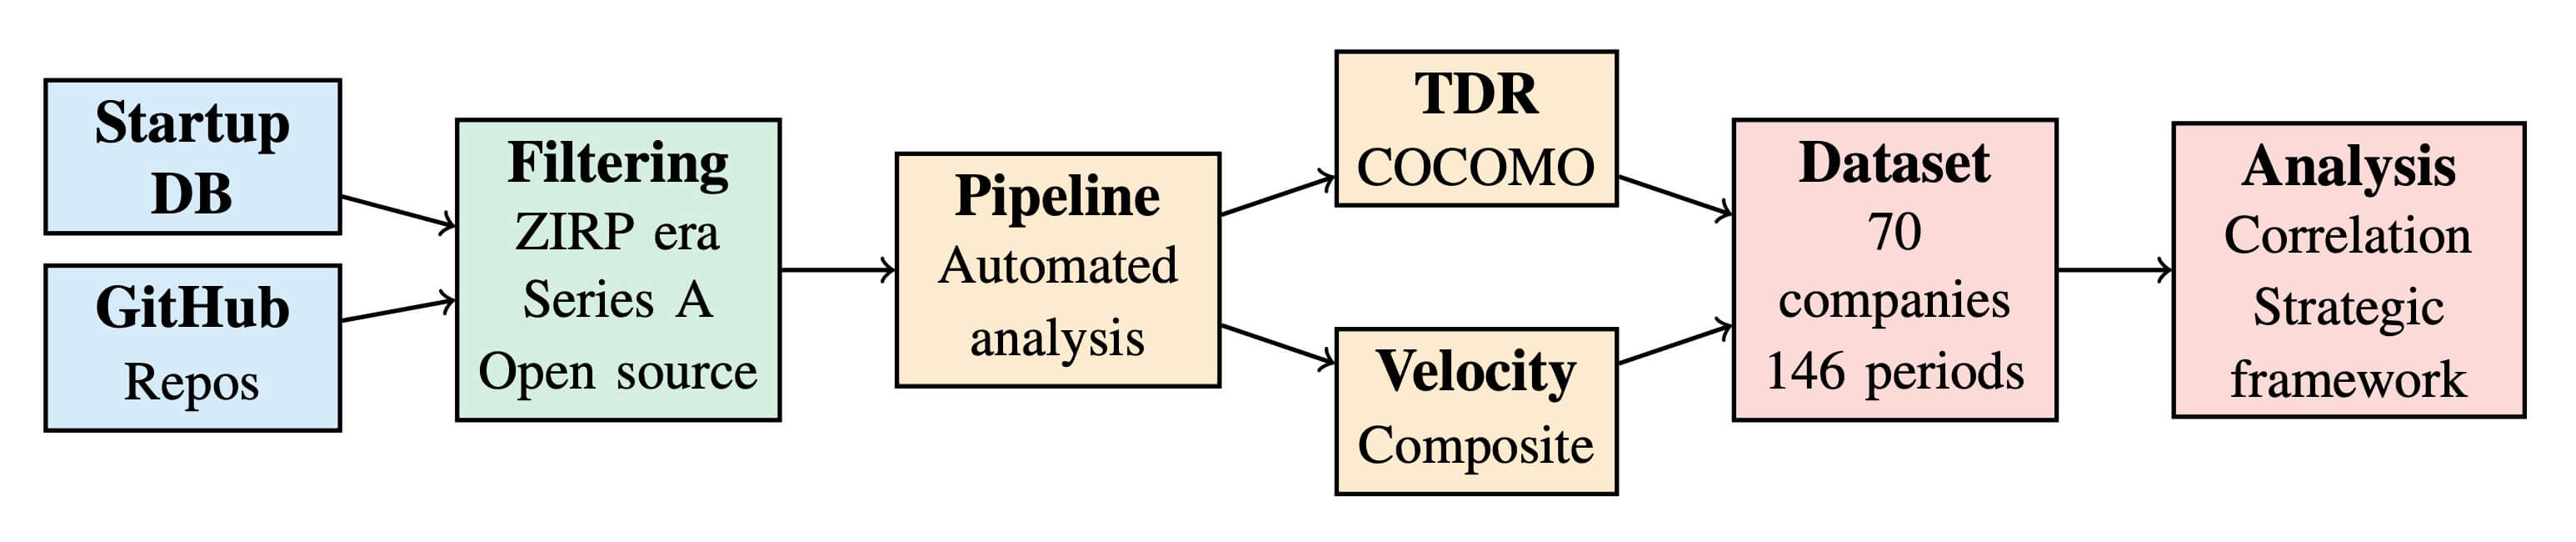
I built a fully automated analysis pipeline that does the following for each company:
- Clones the primary product repository from GitHub
- Checks out the code at the exact commit state before each funding round — so we’re measuring what investors actually saw, not what the code looks like today
- Runs static analysis via the Qlty CLI platform (successor to CodeClimate) to calculate a Technical Debt Ratio (TDR) using COCOMO-based economic modeling
- Calculates development velocity using a composite metric inspired by the CNCF’s project velocity framework: code churn per author + commits per author, normalized across the dataset
- Cross-references with Crunchbase and Tracxn to determine whether the company raised a subsequent funding round
The Technical Debt Ratio is defined as:
TDR = Remediation Cost (effort to fix all detected issues)
      ÷ Development Cost (COCOMO estimate of total dev effort)
Development Velocity is a normalized composite:
Velocity = 0.5 × (Code Churn per Author / Max across dataset)
         + 0.5 × (Commits per Author / Max across dataset)
Both metrics are normalized to enable cross-company comparison. The sample spans six industry categories — from developer tools to databases to security — and only includes companies that raised Series A during the 2009–2022 window with at least 36 months elapsed for subsequent round evaluation. The full list of all 70 companies is in the repository.
The dataset has 146 development periods from 70 companies. The overall funding success rate is 54.1% — a near-perfect split for analysis. The full pipeline and data are open-source. Reproduce it. Challenge it. That’s the point.
Finding #1: Technical Debt Doesn’t Slow You Down
This is the finding that breaks the mental model.
At the company level, the correlation between technical debt and development velocity is r = 0.056, p = 0.667. That’s not weak — it’s essentially zero. Technical debt explained 5.2% of the variance in development velocity. The other 95%? Team capability, tooling, architecture, development infrastructure — everything except how clean your code is.
| Metric | Value |
|---|---|
| Pearson r | 0.056 |
| p-value | 0.667 |
| R² | 0.052 |
| N | 70 companies |
Within the range of technical debt levels observed in venture-backed startups (mean TDR = 0.031), debt simply does not impose the “interest payments” that Cunningham’s famous metaphor predicts. The teams with messy code shipped just as fast as the teams with pristine repos.
This doesn’t mean technical debt is irrelevant — at extreme levels or in mature codebases with millions of lines, the story is probably different. But for startups in their first few years? The data says debt isn’t the bottleneck you think it is.
The bottleneck is everything else: how fast you hire, how good your tooling is, how quickly you make decisions, how little ceremony you impose. Code quality is a rounding error in the velocity equation.
Finding #2: The “Move Fast and Break Things” Crowd Was Right
Here’s where it gets spicy. I classified every funding period into four strategic quadrants based on median splits of debt and velocity (inspired by Fowler’s Technical Debt Quadrant):
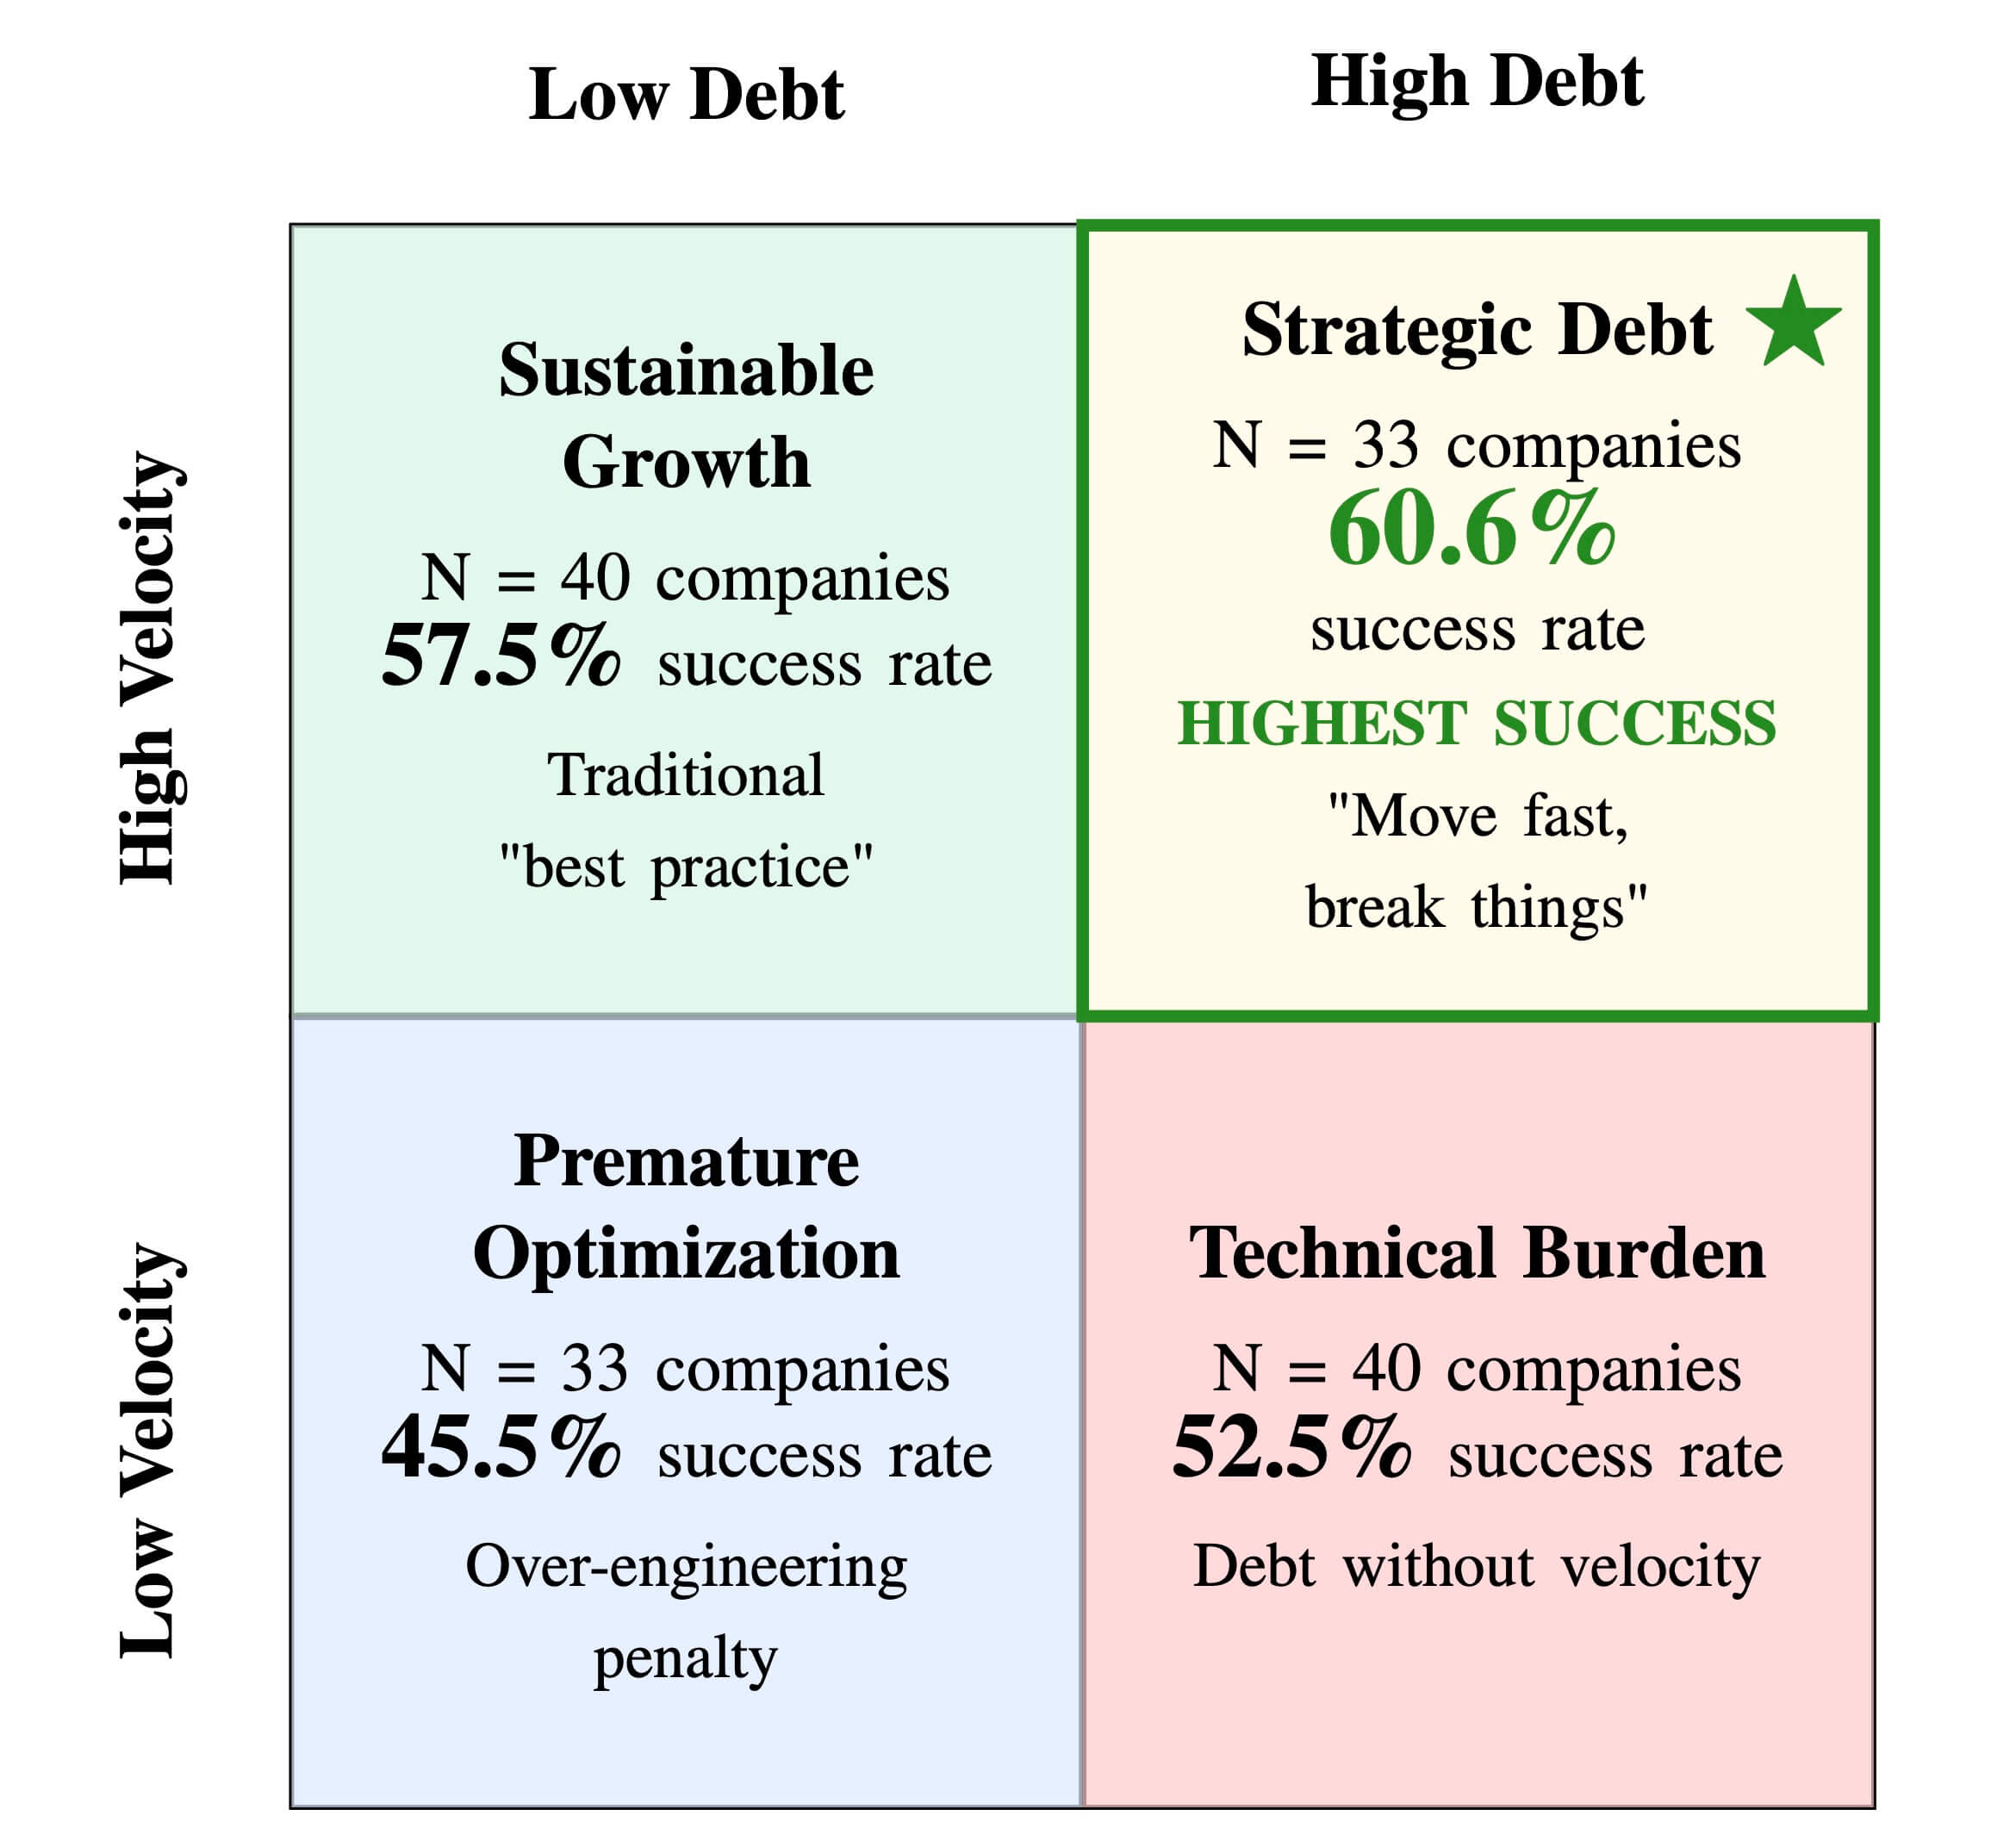
| Quadrant | Description | N | Success Rate |
|---|---|---|---|
| Strategic Debt | High Debt + High Velocity | 33 | 60.6% |
| Sustainable Growth | Low Debt + High Velocity | 40 | 57.5% |
| Technical Burden | High Debt + Low Velocity | 40 | 52.5% |
| Premature Optimization | Low Debt + Low Velocity | 33 | 45.5% |
Read that table again. The companies doing everything “right” — clean code, high velocity — came in second. The companies breaking all the rules but shipping fast came in first.
And the companies with the cleanest code and slowest velocity? Dead last. Premature optimization isn’t just the root of all evil in code — it’s the root of all evil in startup strategy.
The velocity premium is consistent regardless of debt level. Among low-debt companies, high velocity adds +12.0 percentage points to success rates. Among high-debt companies, it adds +8.1 pp. Velocity dominates everywhere.
Finding #3: Velocity Has a Monotonic Relationship With Funding Success
When I break development velocity into quartiles, the pattern is unmistakable:
| Velocity Quartile | Success Rate | Avg Velocity |
|---|---|---|
| Q1 (Lowest) | 47.2% | 0.029 |
| Q2 | 50.0% | 0.063 |
| Q3 | 50.0% | 0.117 |
| Q4 (Highest) | 68.4% | 0.285 |
A clean, monotonic increase. More velocity → more funding. +21.2 percentage points from bottom to top quartile.
Now look at what happens when you do the same with technical debt:
| TDR Quartile | Success Rate | Avg TDR |
|---|---|---|
| Q1 (Lowest Debt) | 44.4% | 0.006 |
| Q2 | 61.1% | 0.021 |
| Q3 | 52.8% | 0.050 |
| Q4 (Highest Debt) | 57.9% | 0.165 |
No clear pattern. And the lowest debt quartile has the worst success rate. At least in this dataset: velocity is the signal, debt is noise.
This Isn’t a Fluke — It’s Robust Across Frameworks
One valid criticism of median-split analysis is that it’s sensitive to where you draw the line. So I tested the findings across three different classification schemes:
Median Split (2×2): Strategic Debt wins at 60.6%.
Tertile Framework (3×3): Low Debt + High Velocity hits 73.3%. High Debt + High Velocity hits 68.4%. High Debt + Medium Velocity hits 72.7%. The velocity effect holds everywhere.
Quartile Extremes (bottom 25% vs. top 25%): The gap is staggering — Very High Debt + Very High Velocity achieves 66.7% success, while Very Low Debt + Very Low Velocity drops to 30.0%. That’s a 36.7 percentage point spread.
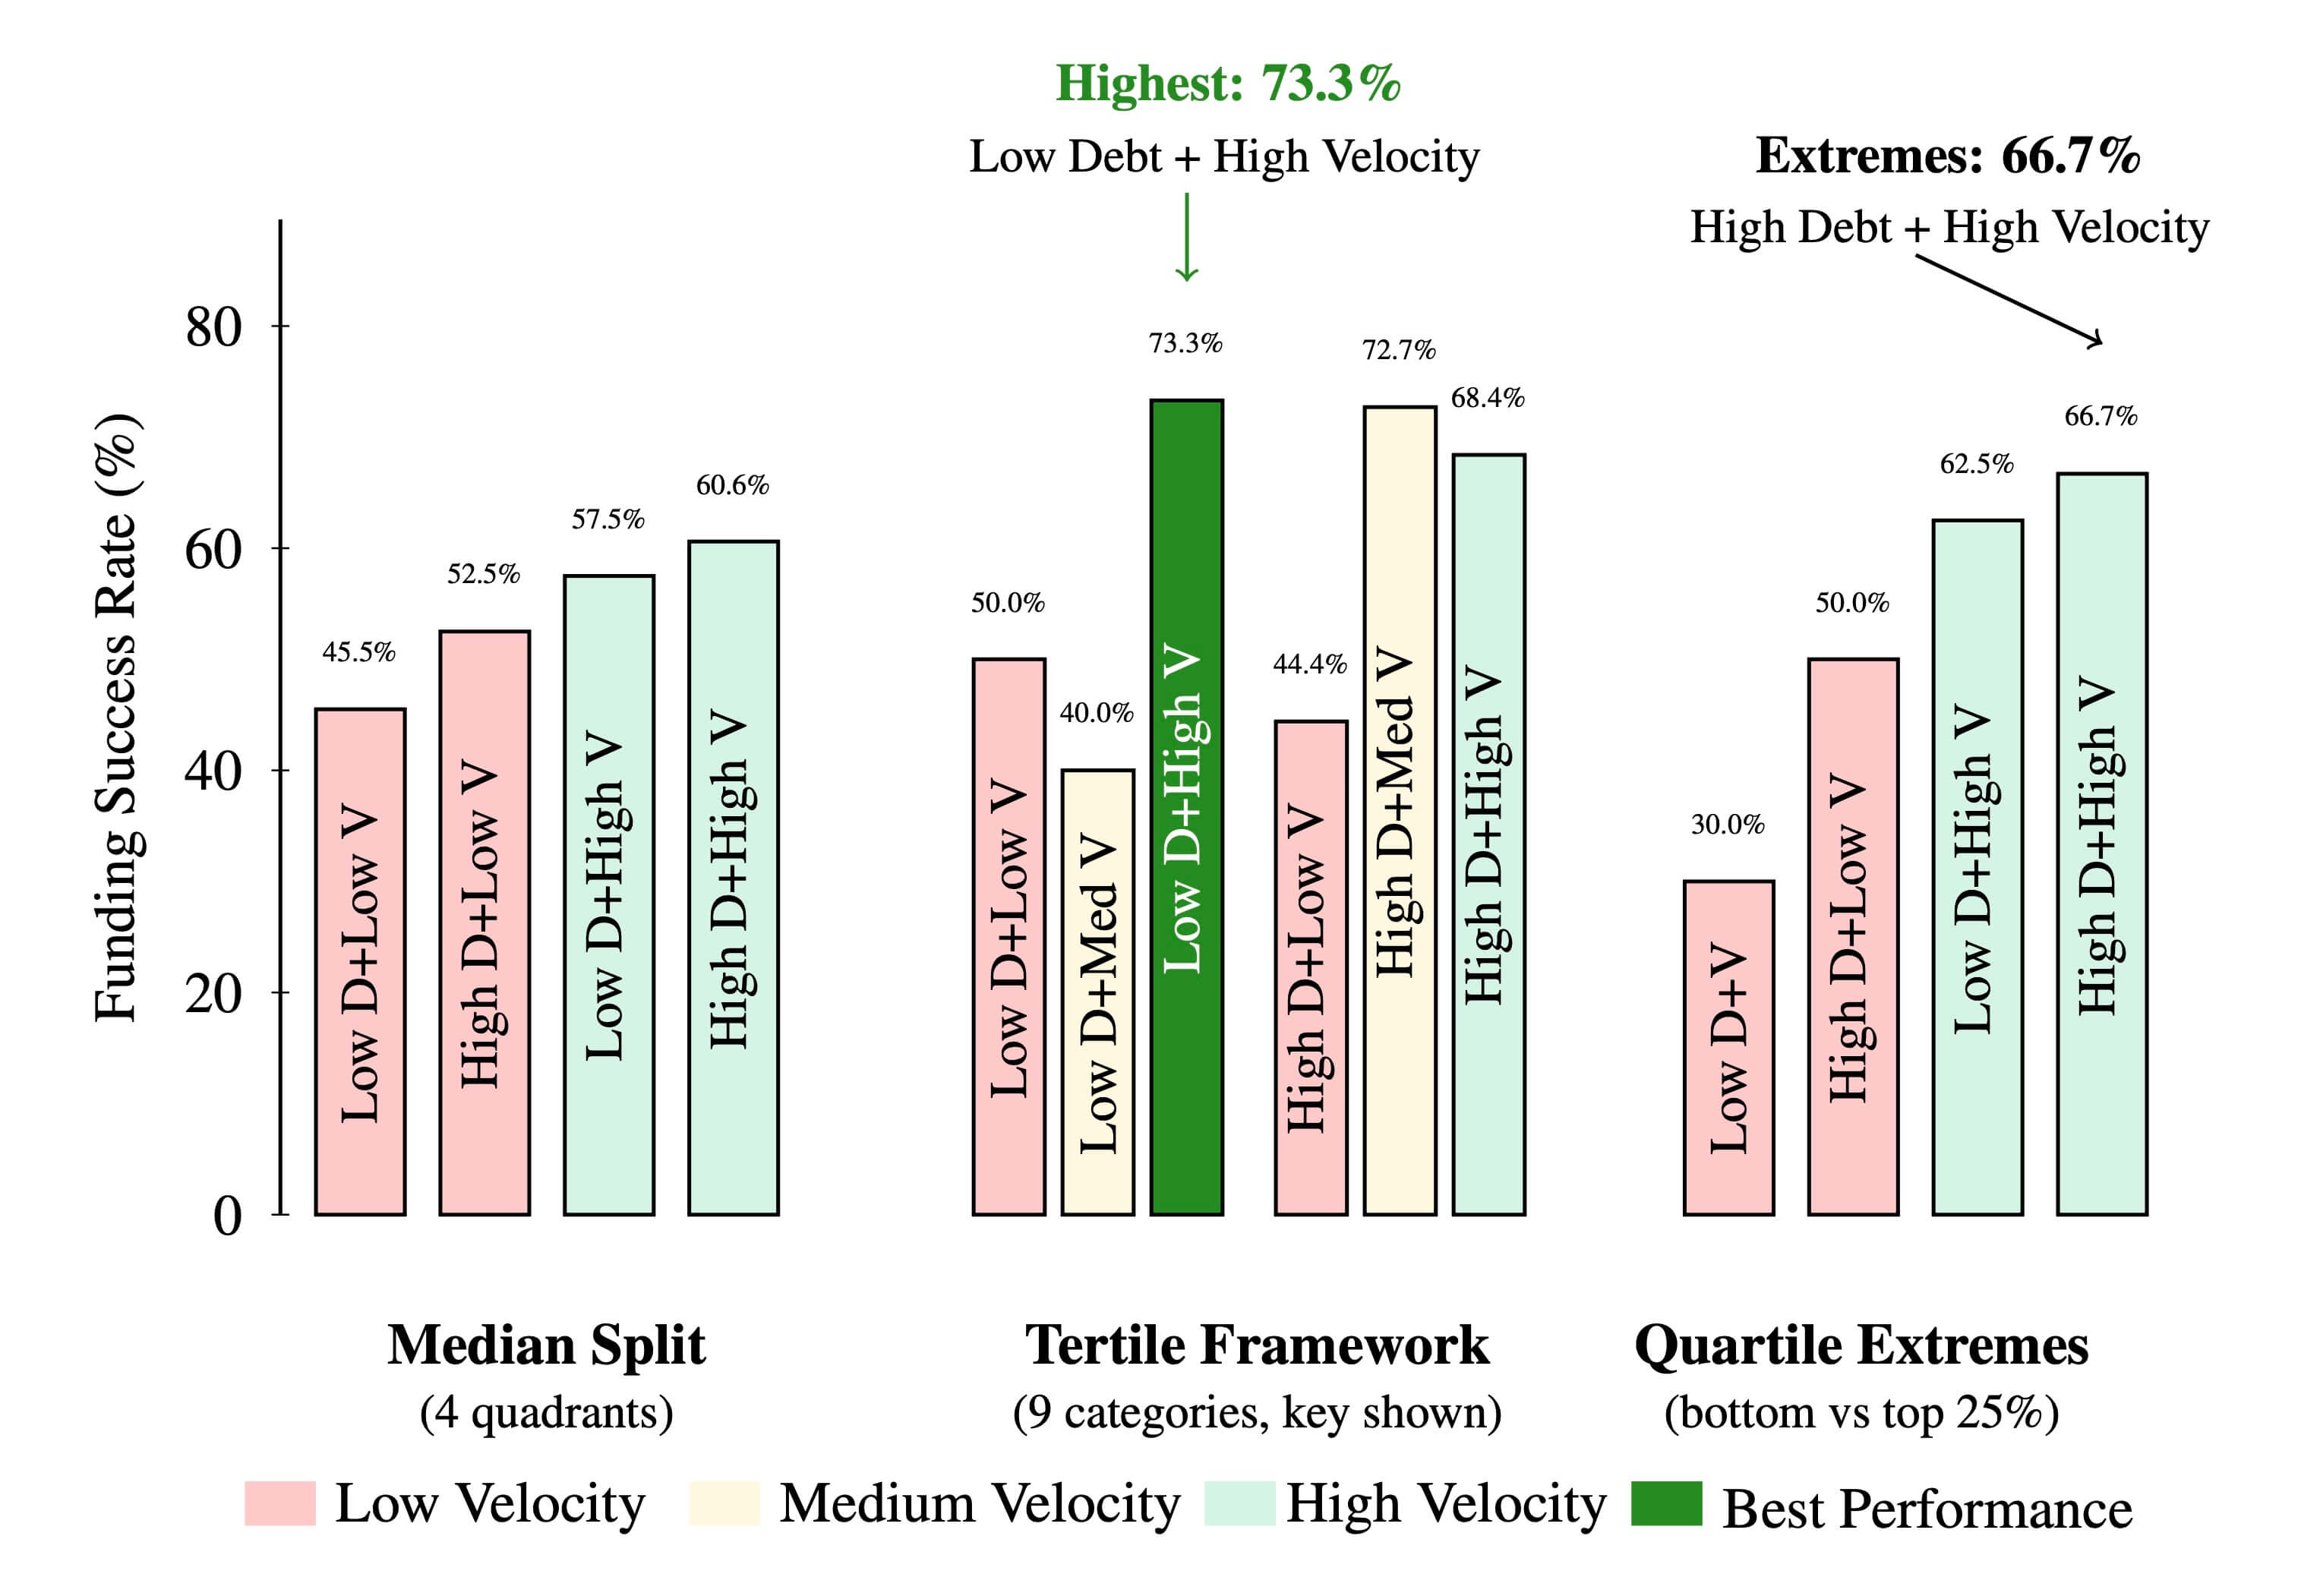
Every framework tells the same story. The velocity advantage is real, consistent, and robust.
Why? The Temporal Arbitrage Theory
Why would taking on debt and shipping fast beat doing things “right”? I propose a framework I call temporal arbitrage — systematically trading future development efficiency for immediate execution capability when current capacity is more valuable than equivalent future capacity.
Three mechanisms make this work in venture-backed environments:
1. Information Asymmetry
VCs don’t audit codebases. They can’t tell if your architecture is clean or a disaster. What they can observe is momentum: feature launches, user growth, commit velocity, product iteration speed. In a world of imperfect information, velocity is the strongest signal investors can actually see. Development velocity becomes a composite proxy for team capability, coordination quality, and market responsiveness — none of which are visible by reading source code.
2. The ZIRP Subsidy
Cunningham’s debt metaphor assumes you pay your own interest. But during the Zero Interest-Rate Policy era (2009–2022), venture capital effectively subsidized the interest payments on technical debt. When your next funding round covers the cost of refactoring, and the penalty for being slow to market is death, the rational play flips: accumulate debt, ship faster, raise the next round, then clean up. The metaphor breaks when someone else pays your interest.
3. Dynamic Capabilities as Compound Advantage
High-velocity teams don’t just ship faster — they learn faster, attract better talent, and generate higher investor confidence. Each advantage compounds into the next. A team that can iterate quickly builds better products through faster feedback loops, which drives user growth, which improves fundraising outcomes, which funds more development. Velocity is a flywheel, not a line item.
The Uncomfortable Implication
Let me be direct about what this data suggests for practitioners:
For founders and CTOs: You may be over-investing in code quality at the expense of market speed. Within typical startup debt ranges, the data suggests debt is not your bottleneck — velocity is. It’s worth asking whether your engineering investments are going into velocity enablers (deployment automation, rapid experimentation infrastructure, team capability) or into code polish that the market doesn’t reward.
For engineering leaders: The R² of 0.052 means that code quality explains almost nothing about how fast your team ships. If you want to move faster, look at your tooling, your decision-making processes, your hiring — not your linting rules.
For investors doing technical due diligence: In this dataset, development velocity was a stronger predictor of funding success than code quality. The monotonic relationship between velocity and success (47.2% → 68.4%) suggests it may deserve more weight in technical evaluations — at least during capital-abundant periods.
What This Is NOT
Before this gets misread on Hacker News — let me be clear about what I’m not saying:
This is not a license to write garbage code. The “Strategic Debt” quadrant works because these teams are fast and accumulate debt as a side effect of speed. The “Technical Burden” quadrant (high debt, low velocity) has mediocre outcomes. Debt without velocity is the worst of both worlds.
This is not universal. These findings are specific to the ZIRP era (2009–2022), open-source VC-backed companies, and code-level debt measurable via static analysis. The post-ZIRP environment (higher rates, capital scarcity, profitability focus) may tell a completely different story — and that’s exactly the natural experiment we should be studying next.
This is not causal. The study is observational. It’s possible that high-capability teams simply tolerate more mess because they can, rather than debt enabling velocity. Reverse causality is a real concern. I also can’t control for founder experience, network effects, market timing, or competitive intensity.
Architectural debt is invisible here. Static analysis captures code-level issues — style violations, complexity, duplication. It doesn’t capture the architectural decisions that truly make or break scalability. A company with “clean” code-level metrics might harbor deep architectural problems, and vice versa.
The Bigger Picture
The thesis title is “Technical Debt as a Strategic Trade-Off” and that framing is deliberate. The software engineering community has treated technical debt as an unconditional liability for three decades. This data suggests it’s actually a context-dependent strategic variable.
In capital-abundant environments with compressed competitive windows, the optimal strategy may be to accept debt, maximize velocity, and let external funding subsidize the costs. In capital-scarce environments with longer runways, the calculus probably reverses. The engineering principles don’t change — but the optimal application of those principles depends on the economic and competitive context you’re operating in.
Traditional software engineering wisdom was built for a world of stable, revenue-generating organizations maintaining long-lived systems. Venture-backed startups in a zero-rate environment may be playing a different enough game that the same rules don’t apply in the same way.
Of course, this study has real boundaries. It’s 70 companies — meaningful, but not massive. It’s open-source companies only, which may behave differently than proprietary startups due to community contributions and transparency dynamics. It captures code-level debt but not the architectural debt that arguably matters more. And most importantly, it’s specific to a macroeconomic era that has already ended. The post-ZIRP world — higher rates, capital scarcity, profitability mandates — could easily invert these findings. That’s the study I’d love to see someone run next.
Still, within its scope, the pattern is consistent enough to be worth taking seriously: during the ZIRP era, the entrepreneurs who thrived weren’t necessarily those who built it perfectly — they were those who built it first.
Reproduce This
The complete analysis pipeline, dataset, and methodology are open-source:
- Thesis: Available in full with all methodology details, statistical procedures, and appendices
- Source Code: github.com/maxcodefaster/tdr-velocity-analysis
- Dataset: 70 companies, 146 funding periods, all metrics included
The pipeline clones repos, checks out historical states, runs static analysis, calculates TDR and velocity, and cross-references with funding outcomes. I’d genuinely welcome people forking the repo, running it on different samples, or testing the post-ZIRP cohort. The whole point of open-sourcing this was to make it challengeable.
This post is based on my master’s thesis “Technical Debt as a Strategic Trade-Off: An Empirical Analysis of Execution Speed and Funding Success in Venture-Backed Startups” completed at the University of Twente and TU Berlin. Thanks for reading — I’d love to hear your thoughts, especially from anyone sitting in the “Premature Optimization” quadrant right now.